
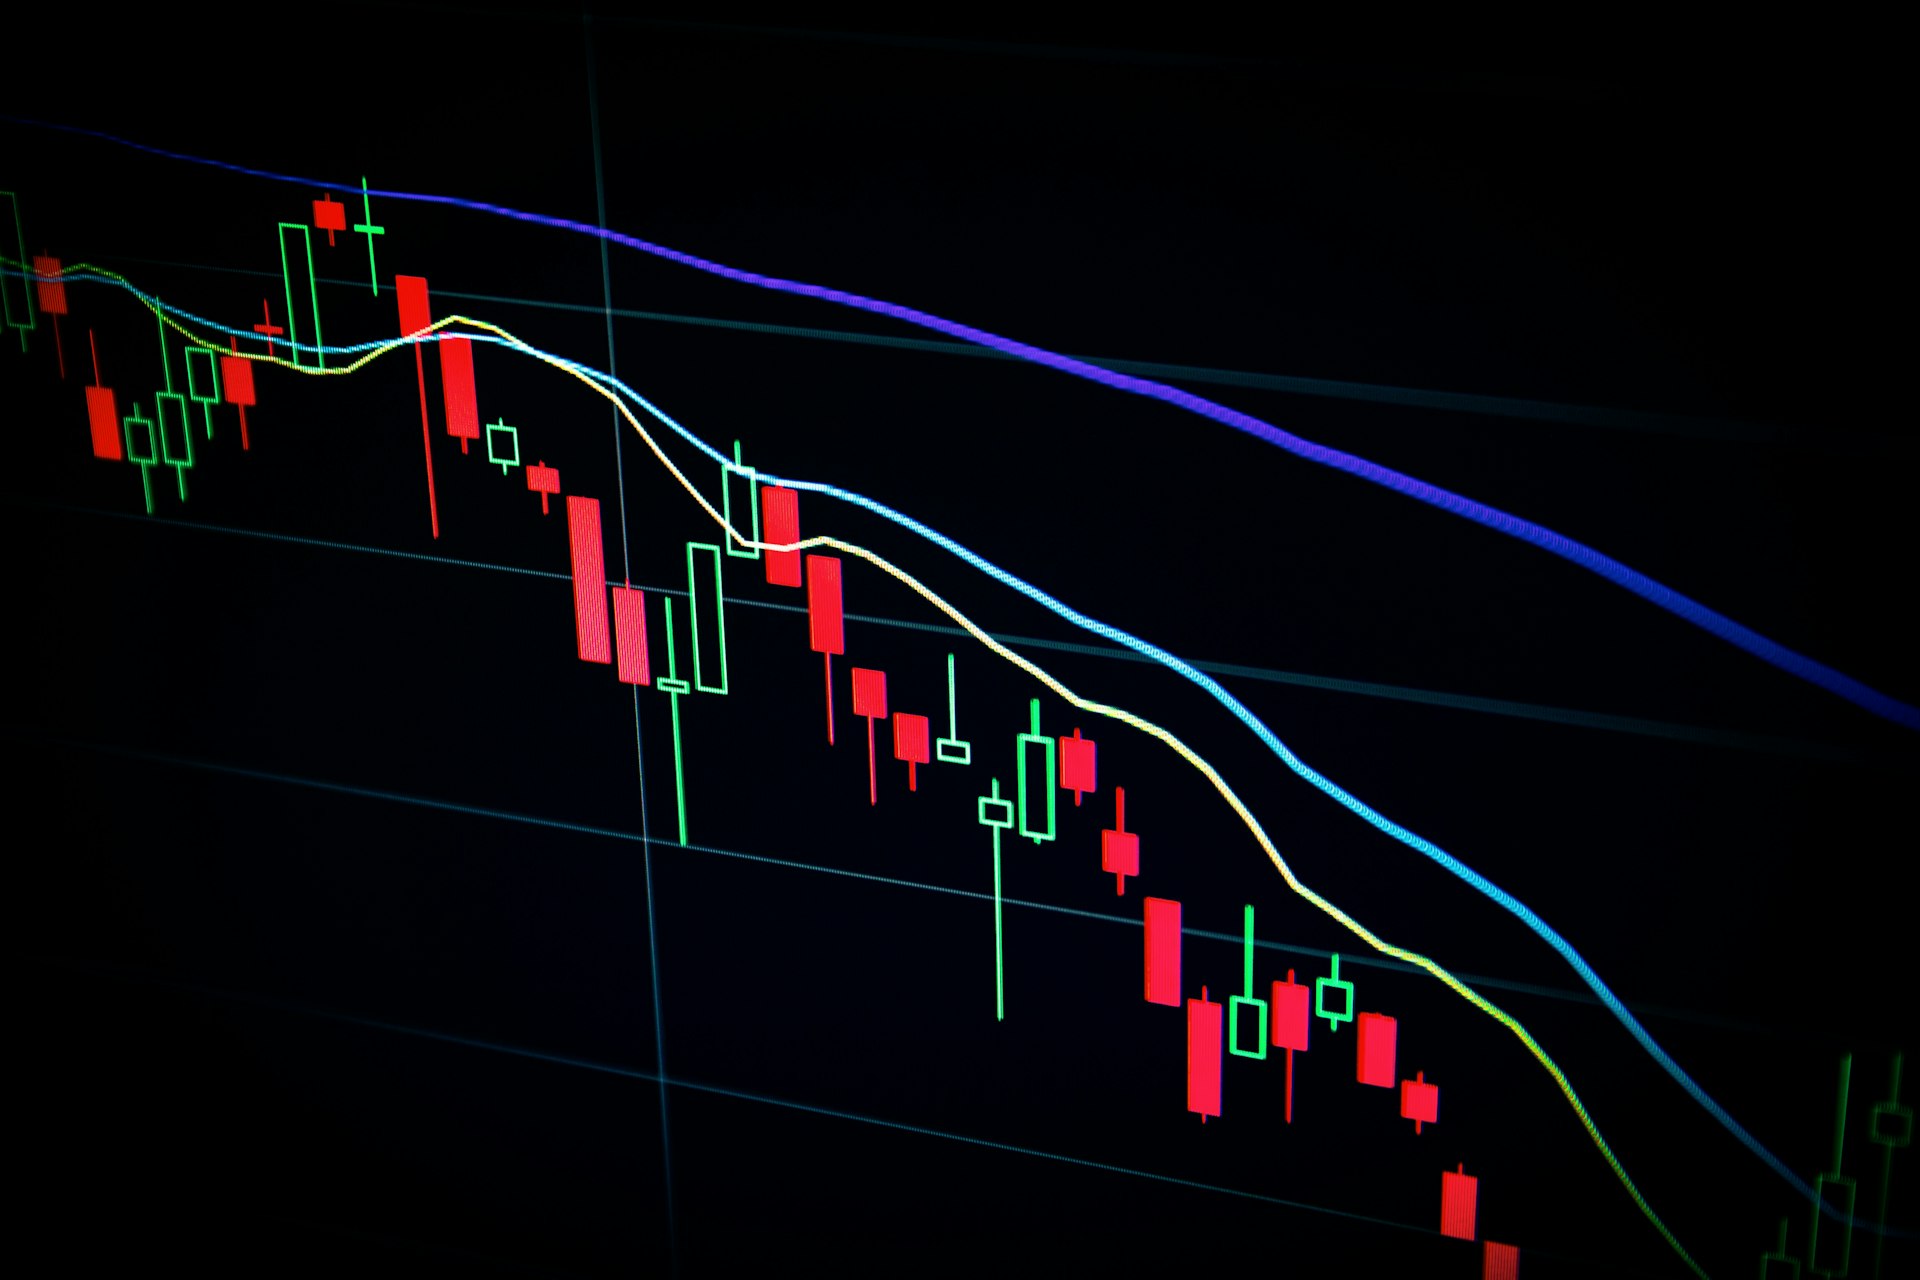
The S&P 500 is trading near all-time highs. Historically, summer corrections are common — but not inevitable. What the data shows.
Summary
The S&P 500 is showing classic overheating signals following a strong first half of the year. Historical patterns, seasonal weakness, and elevated valuation levels warrant caution.
Key Takeaways
- Potential summer correction in the S&P 500: -5% to -8%
- Current P/E ratio: approximately 22x, modestly elevated
- Fed rate signals remain restrictive
- Seasonal pattern: August and September have historically tended to be weaker months for equities
Market Analysis
Following strong first-half performance, the S&P 500 is more vulnerable to short-term pullbacks. Extended upward moves in particular increase the likelihood that investors take profits, driving the market into a consolidation phase.
The combination of elevated valuations, a persistently challenging rate environment, and seasonally weaker months points to heightened downside risk over the summer.
Opportunities
- Strong corporate earnings can continue to support current valuations
- AI investment remains a significant growth driver
- A potential Fed rate cut in autumn could provide fresh momentum
- A moderate correction could create attractive entry points
Risks
- Profit-taking following a strong first half
- Elevated valuations in the technology sector
- Geopolitical uncertainty
- Inflationary pressure from commodity and energy costs
- Weaker macroeconomic data could weigh on market sentiment
Conclusion
At this point, a moderate summer correction would not be a warning signal — rather, it would represent a healthy consolidation following a strong market run.
For long-term investors, a pullback could open up new opportunities. What matters most is avoiding emotional reactions and maintaining a disciplined focus on valuations, trends, and risk signals.
Corrections of 5–10% are normal market phases, not crash signals. Long-term investors should view pullbacks as opportunities to add to positions. The structural growth drivers within the S&P 500 — particularly AI and technology — remain intact.
NVDA fully analyzed
AI score, trend, RSI and valuation at a glance.
Simulate investment
Calculate how an investment would have performed historically.
Discover NextSignal
All stocks with score, trend and AI assessment at a glance.