

Ahead of NVIDIA's Q2 2027 print on August 26: why public consensus understates the real bar, the five KPIs that will move the stock, and how the 75% gross margin debate plays out.
Summary
NVIDIA reports Q2 2027 results on August 26, 2026, after market close (11pm Zurich time). Public consensus sits at $91.91B revenue and $2.08 EPS — only about 1% above the guide midpoint of $91.0B. That's not a real whisper hurdle: NVIDIA beat revenue consensus by 3.9% and 3.0% in the last two quarters respectively. The realistic stock-moving bar is therefore closer to $94-95B. Non-GAAP gross margin is guided at 75.0% ±50bp.
Investment Readout
Stance: Hold / wait for proof — not because the business is weak, but because a very good quarter is already the price of admission.
More important than the Q2 beat itself is the Q3 guide: it must show that Blackwell Ultra, networking, and hyperscaler capex support further sequential acceleration without gross margin falling below 74.5%.
What already looks priced in:
- Near-flawless Blackwell execution and tight capacity
- Continued double-digit sequential Data Center growth
- Gross margin around 75% despite system mix and ramp costs
- No China revenue needed to hit the guide
The possible variant wedge: Not GPU unit sales alone, but the share of networking and full-stack systems could be keeping the revenue durability and moat underestimated. The stronger full systems grow, the more real the debate becomes over whether mix structurally caps gross margin at 75%.
The Expectation Bar in Detail
| Metric | Q2 FY27 Bar | Last Base | What the Stock Needs | Status |
|---|---|---|---|---|
| Revenue | Guide $91.0B ±2%; consensus $91.91B | Q1 $81.6B; +20% QoQ / +85% YoY | ≈$94-95B plus a strong Q3 outlook | High bar |
| Data Center | No reliable public consensus | Q1 $75.2B; 92% of revenue | Broad-based growth, not single hyperscalers | Core KPI |
| Compute | No hard estimate | Q1 $60.4B; +18% QoQ | Blackwell/Ultra ramp without a transition gap | Volume |
| Networking | No hard estimate | Q1 $14.8B; +35% QoQ / +199% YoY | Continues outpacing compute | Quality |
| Non-GAAP GM | 75.0% ±50bp | Q1 75.0% | ≥75% with a credible path | Debate |
| Non-GAAP EPS | Consensus $2.08 | Q1 $1.87 | Beat must be operational, not tax/mark-driven | Quality check |
"Stock hurdle" is an analytical inference from recent surprise rates and valuation, not a proprietary whisper survey.
The Five KPIs That Will Move the Stock
- Q3 revenue guide — the single most important number. A good Q2 beat with only in-line Q3 guidance could be read as a peak signal.
- Data Center compute growth — shows whether Blackwell Ultra unlocks incremental demand or merely replaces Hopper/Blackwell.
- Networking growth — shows whether NVIDIA is capturing more value per AI factory and deepening its systems moat.
- Gross margin and mix bridge — product mix, systems share, manufacturing costs, supply chain and China need to be quantified.
- Customer and demand breadth — Hyperscale vs. ACIE: does the new segmentation show a broadening capex cycle?
The Margin Debate: 75% Is Both Strength and Risk
Bull case: Software, networking, platform pricing and better yields offset more expensive systems. 75%+ stays sustainable while revenue outgrows opex.
Base case: Mix headwind from complete rack systems keeps margin near 75%. Operating leverage stays strong; margin isn't an added multiple driver.
Bear case: Ramp costs, supply chain, customer pressure or unfavorable system mix push margin below 74.5%, raising doubts about whether revenue growth is increasingly "bought."
Important: starting Q1 FY27, NVIDIA's non-GAAP figures include stock-based compensation; historical non-GAAP numbers were restated. Q1 GAAP EPS of $2.39 was also heavily influenced by $15.9B in gains from equity investments — revenue, margin, operating income and cash flow are more informative than GAAP EPS for an operational read.
Print and Reaction Scenarios
| Bear | Base | Bull | |
|---|---|---|---|
| Q2 Revenue | $89-91B | $93-95B | $96-98B |
| Non-GAAP GM | 73.8-74.5% | 74.7-75.2% | 75.3-76.0% |
| Q3 Guide | <$100B | $101-104B | >$105B |
| Operational Read | Ramp/capex digestion, margin breaks | Blackwell execution intact, growth normalizing | Broad demand, networking upside |
| Likely Stock Reaction | Sharply negative | Mixed — guide and margin decide | Positive if Q3 and margin confirm |
All scenario values are analyst assumptions, not consensus data.
Management Questions — With Listen-Fors
- How is growth and pipeline split between Hyperscale and ACIE? Confirms: ACIE grows faster. Breaks: growth stays concentrated in a few hyperscalers.
- What factors move gross margin in H2 FY27? Listen for: system mix, yield, memory, networking, manufacturing and pricing — in basis points.
- Is Blackwell Ultra incremental or substituting existing demand? Confirms: new inference workloads. Breaks: customer deferrals or a transition gap.
- How sustainable is 199% YoY networking growth? Listen for: NVLink, Spectrum-X, InfiniBand, attach rate.
- How much demand is power/infrastructure-constrained rather than GPU-supply-constrained? Confirms: clear timelines. Breaks: compute ships but deployments slip.
- What would the China opportunity be under a changed licensing regime? Listen for: a clear separation of optionality from current demand.
- How should investors read GAAP EPS and cash flow after large equity mark gains?
Positioning Framework
| Signal | Action | Why |
|---|---|---|
| Revenue ≥$95B, GM ≥75%, Q3 ≥$104B | Add / press | Estimate revisions stay upward |
| Revenue $93-95B, GM ~75%, Q3 $101-104B | Hold | Fundamentally strong, little new information |
| Beat, but GM <74.5% or Q3 <$100B | Trim / re-underwrite | Quality of growth deteriorates |
| Weak print with a clear temporary cause | Wait for proof | Only buyable after a credible timeline emerges |
Sources and Data Gaps
- NVIDIA Q1 FY27 results and Q2 guidance (company figures, segment data)
- NVIDIA event page (confirmed date: August 26, 2026)
- Investing.com and Public.com consensus/earnings data (as of August 10, 2026)
- Market data: NVDA $223.96, market cap ~$5.46T, TTM P/E ~34.1x (close August 7, 2026)
Just 1% above guide midpoint — NVIDIA beat consensus by 3-4% in each of the last two quarters
Derived from recent surprise rates, not a surveyed whisper number
Debate over whether system mix structurally caps margin at 75%
A strong Q2 is already priced in — what matters is the Q3 outlook and whether gross margin holds above 75%.
Stance: Hold / wait for proof. The realistic stock-moving bar sits at $94-95B in revenue, not the public consensus of $91.91B. The Q3 guide and gross margin (74.5% threshold) will decide the stock reaction, not the Q2 beat itself.
These companies could also benefit from this theme.
NVDA fully analyzed
AI score, trend, RSI and valuation at a glance.
Simulate investment
Calculate how an investment would have performed historically.
Discover NextSignal
All stocks with score, trend and AI assessment at a glance.
Related articles
 AI & Technology
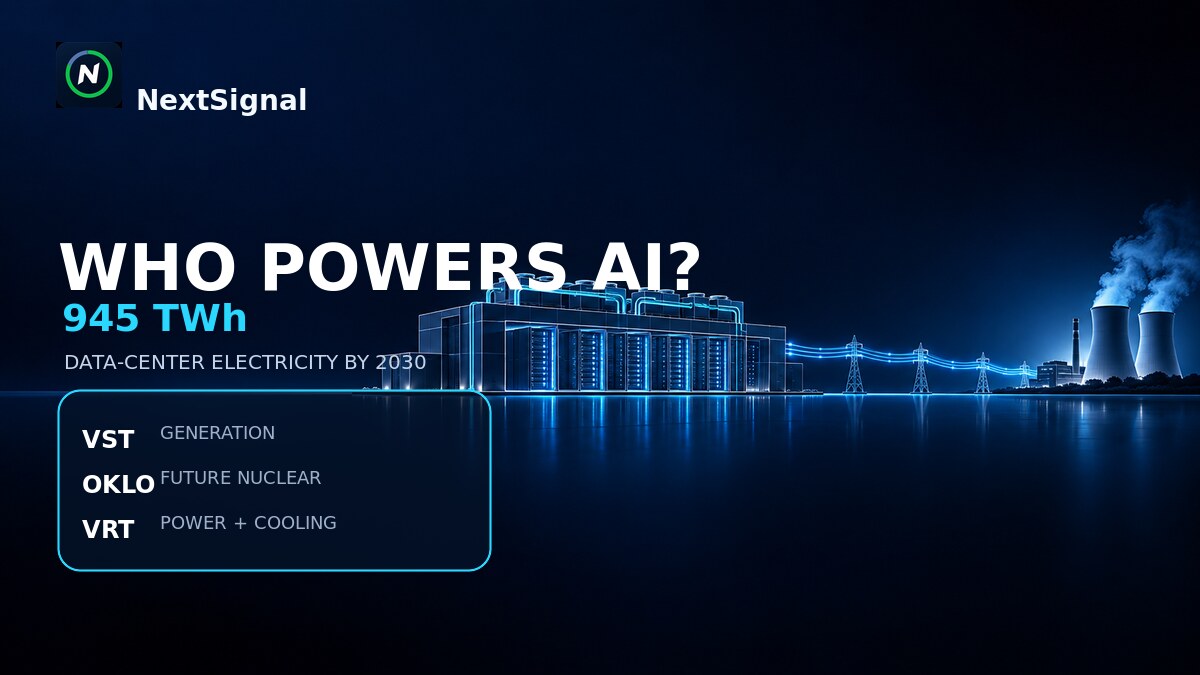
AI braucht nicht nur Chips: Wer liefert den Strom für den AI-Boom?
Rechenzentren könnten bis 2030 rund 945 TWh Strom verbrauchen. Vistra, Oklo und Vertiv stehen dabei für drei unterschiedliche Ebenen der AI-Energie-Infrastruktur.
Read article AI & Technology
AI liefert ROI – doch der Sprung vom Pilotprojekt in den Betrieb stockt
Fast drei Viertel der befragten Unternehmen melden positive finanzielle Resultate mit AI – doch weniger als ein Drittel kommt über Pilotprojekte hinaus. Warum Umsetzung jetzt zum entscheidenden Engpass wird.
Read article AI & Technology
AI braucht Leitplanken: Nvidia will auch die Kontrollschicht besetzen
Nvidia erweitert sein Angebot über Rechenleistung hinaus: OpenShell setzt Grenzen für AI-Agents, Sentry überwacht sie auf Hardware-Ebene. Strategisch relevant – aber noch kein Umsatzbeweis.
Read article